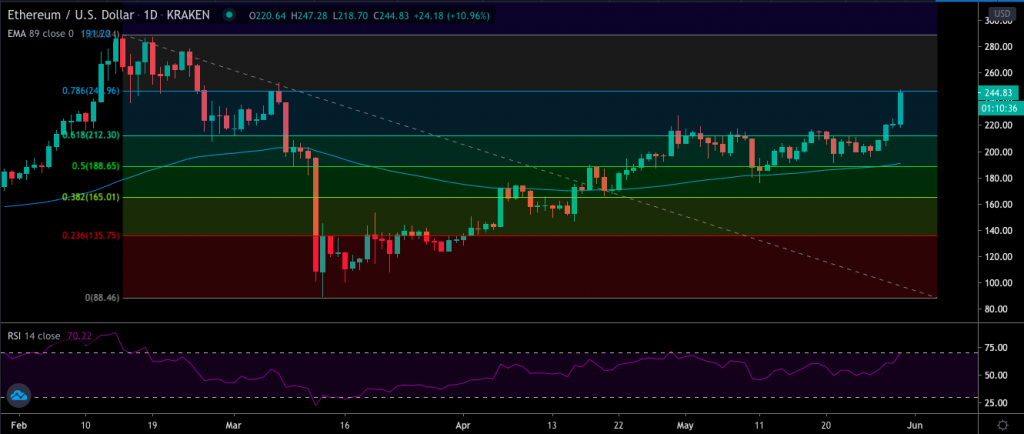
From the technical perspective, $245 is a significant resistance for Ethereum (ETH) as it marked the top before the mid-March crash took the price down to $100 which lined up perfectly with the 0.786 Fibonacci retracement level.

If ETH manages to surpass the level, the next major resistance according to Fibonacci will be at $288. Relative Strength Index (RSI) has surged into the overbought territory above 70, short-term traders should be aware of a possible pull-back.
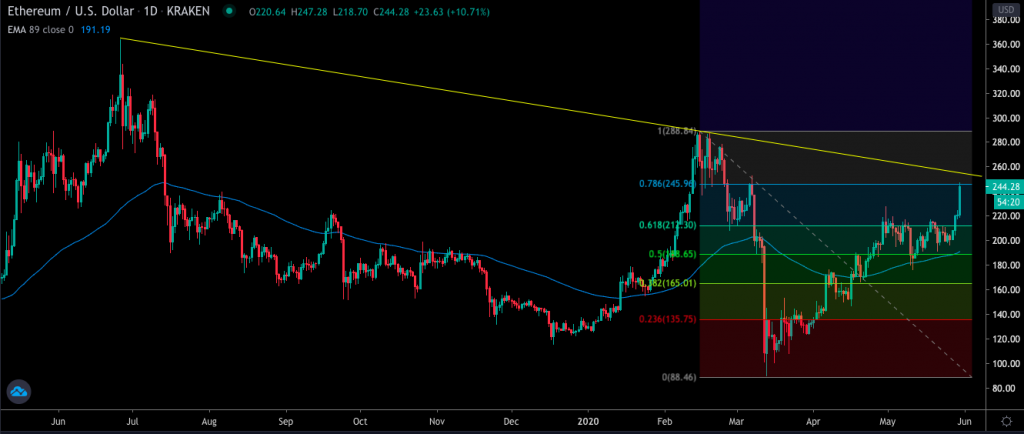
The $288 also coincides with the yearly-high Ethereum made on February 14. Before reaching that local top, however, ETH will be facing a long-term suppressing trend line dating back to July 2019. Smashing through the downtrend will boost the bullish momentum for the coin and an attempt to make a new yearly high is now not so far-fetched.

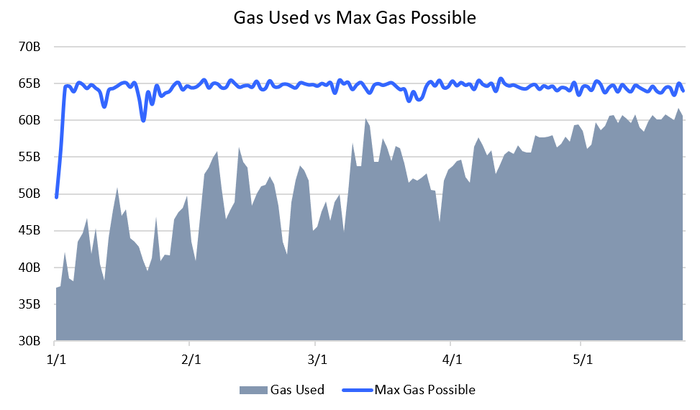
Report from Delphi Digital suggested that the GAS usage on Ethereum blockchain has reached a new all-time-high (ATH) as people start building on top of ETH blockchain once again.

While the SCN30 Index, with ETH weighted the most at 20%, has jumped 9.49 points to 158.37 marking a weekly high. Cardano (ADA)’s mainnet hype is still gripping investors’ attention resulting in almost 20% gain during the past 24 hours.
You may also want to read: New Crypto & Gold Index Live on Bloomberg Terminals & Refinitiv


