I wrote three books about bitcoin and publish a newsletter about cryptocurrency. My family’s financial welfare depends on bitcoin’s success. I don’t want to answer the question in my title, but I feel compelled to bring it up.
When you look at the data, trends, and patterns of behavior we saw as bitcoin’s price approached its four previous market cycle peaks, you will see the same things today as you did for each of those other times.
That history suggests bitcoin’s bull run will end next month at a price of roughly $90,000.
I realize that seems crazy. On March 11, 2021, I published a detailed post for subscribers of my Crypto is Easy newsletter going deep into the data and correlations. I summarize them below and recommend you read that other post for a more nuanced and informative explanation. This article hits only the high notes.
Also, make sure you caught my post from earlier this month, Bitcoin’s Market Cycle Peak is a Lot Closer Than You Think.
Mark, don’t even bother. Institutions will never let that happen!
Yes, some say institutions will never let the price crash. No more bear markets. Only up forever. They’re all FOMOing in, buying up even the slightest dip. “Wall of institutional money.”
Sounds great.
To sustain this bull market, we need institutions to HODL, not just buy. After all, they can’t push prices higher when they’re selling their bitcoin right after they get it.
Look at the realized cap HODL waves, which show the movements of bitcoin among older and newer wallets based on the value of the bitcoins that move.
Unlike the HODL waves you’re probably used to, this metric quantifies the influence those HODLers have on the market. Rather than calculate a percentage of people or wallets, it calculates the percentage of bitcoin’s market value.
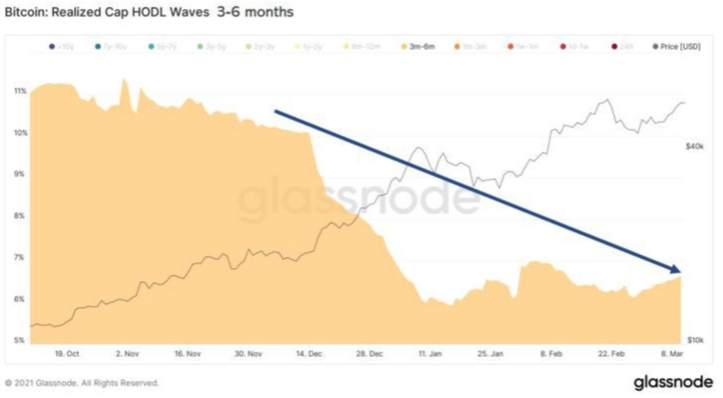
We know institutions accumulated a lot of bitcoin from September to December.
If they’re still HODLing that bitcoin, we should see it reflected in some growth in the band that represents people who acquired bitcoin in the past 3–6 months.
We don’t see that at all.

In fact, we see a steep drop dating back months.
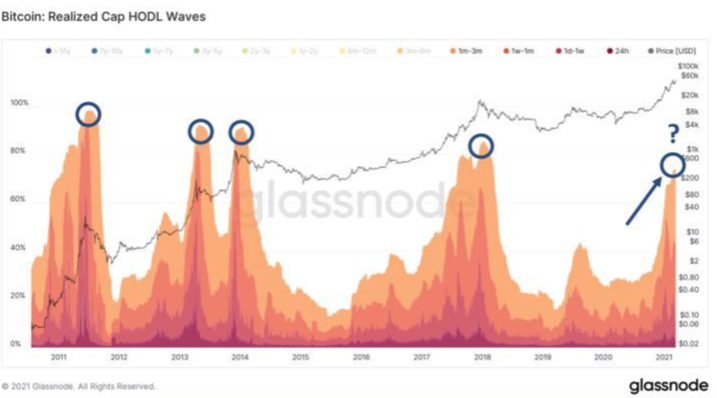
This chart lumps all the short-term HODLers, people who’ve had bitcoin for three months or less. Blue circles are market cycle peaks.

Those shorter-term bands keep widening, resulting in spikes on this chart. You can see the spikes lead to market cycle peaks.
As you can tell from the arrow, this most recent spike is approaching (but not quite at) levels we only see at market cycle peaks.
As I explained in previous updates, it’s unlikely institutions or their custodians are moving money from old wallets to new ones within their own portfolios, at least not in any significant amount.
In other words, those short-term bands are not rising from big HODLers moving to newer wallets that they control. Rather, they’re shipping off their bitcoin to somebody else.
Certainly, some institutions are HODLing. It’s just not enough to change the trend.
Yea, but money’s pouring into Grayscale and the ETFs!
It was until February.
Since then, flows into Grayscale bitcoin trust have fallen off a cliff and even went negative in March.
Flows into the Purpose bitcoin ETF have dried up, too — from 2,200 bitcoins on the first day to an average of 200 or less since then. On top of that, 3iQ sold some bitcoin from its fund.
That signals fatigue or disinterest among institutional investors and traditional retail speculators, at least in the very short-term.
(Yes, NYDIG says it has a few billion dollars of institutional money lined up. For a $1 trillion asset like bitcoin, a billion dollars doesn’t seem like enough to move the market.)
Ok, that doesn’t matter, that data models predict higher prices for longer
Sure, depending on which model you pick. S2F, expanding cycles, hash cycles, four-year cycles, halving cycles, the list goes on.
There’s a model for every outcome you want to see, and they all disagree with each other.
While I don’t make decisions based on data models, I found a few that fit my bias. They all tell us the market’s approaching its peak.
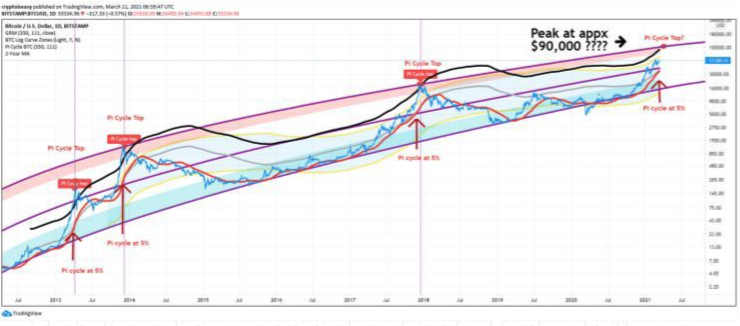
- Pi cycle, a mathematical formula that maps the intersection of two specific moving averages. When those averages converge, the market is near its peak. Today, those averages are 5% apart and getting closer with each passing day. All four previous times we saw that pattern, the market peaked within weeks.
- Two-year moving average multiplier, a line bitcoin breaches only when it reaches market cycle peaks. We’re very close to breaching that line.
- Logarithmic growth curve, an algorithm that marks the big peaks. When bitcoin’s price hits the top of the curve, it signals the absolute peak and triggers deep, long bear markets. If bitcoin’s price remains on this trajectory, we will hit the top of that curve in a month.
- Golden ratio multiplier. Whenever bitcoin’s price goes above that line, it hits a market cycle peak. That line projects to hit the top of the logarithmic growth curve at the same time as you would expect the lines of the Pi cycle to converge.
All of these signals meet next month at a price of roughly $90,000.
For this summary, I’ll overlap all of them on one chart so you can see the trajectory:

In my longer update, I delve into this data more deeply. Really interesting stuff.
Bottom line?
Every time we see those signals converge, we get a crash of +77% and a bear market.
Coincidences! Anybody can pick whatever data they want
Yes. Anything you can do, I can do better
I don’t offer predictions or statistical proof, just food for thought. The more coincidences you see, the more likely it is that they mean something.
We’re long overdue for a severe crash (not a dip) or at least a long consolidation, and maybe we will get that before the market cycle peak. If so, you can throw out all this data. Bitcoin will crash, the market will reset and lay a strong foundation for that big, long bull market that everybody expects.
Without that crash or multi-month consolidation, we will head to the market cycle peak a lot sooner at a much lower price than you expect.
But the bull market just started
Are you sure?
Bitcoin’s price has gone up for more than two years. In January 2019, it was $3,200. In January 2020, it was $7,000. In January 2021, it was $25,000.
On those dates, the total altcoin market was $37 billion, $53 billion, and $215 billion.
Higher each year.
We’ve been in this bull market for a while, even if it hasn’t felt like one or it hasn’t met the dictionary definition of “bull market.”
Now, the momentum has shifted. This plane’s running out of fuel.
It’s ok to refuel
Do you want to hop on a plane when it’s already running out of fuel? Or do you want to wait until it lands so you can fill up the tank and then start zooming again?
Bitcoin’s price can go a lot higher, but it needs to land and refuel. Otherwise, it will crash.
Not a 30% crash like we’ve seen so many times. Not even a 50% crash like we got in 2020 and 2019.
A far bigger crash.
We still have room to run. You can realistically double your portfolio in a month or two, and if you have a lot of altcoins, you could do even better. That’s an opportunity you can’t get in any other market.
At great risk, though.
HODLers don’t care
Long-term, none of this matters. Bitcoin’s price will almost certainly go way higher in the future than it is today.
If you’re willing to HODL the peak and wait six months to three years for your investment to get back to even, then you don’t have to worry about a thing. No matter what happens in the coming months, you’ll be fine in the long run.
For me, that’s a big risk to take and a long time to wait. I don’t want to be underwater for that long.
You probably don’t, either.
It’s different this time
No. We’ve been here before four times already, with each market cycle.
Four times.
Same patterns, Same relationships. Same things we see at the end of each market cycle.
It’s not different. It’s not different at all.
It’s exactly the same.
Why should we expect a different outcome?


