Since the beginning of this month, Altcoins have seen massive gains compared to their predecessor, Bitcoin. Thus, reluctant investors took interest in these alternative coins due to the fact that BTC’s price movement seems rather slow and boring compared to those with lower market capitalizations.

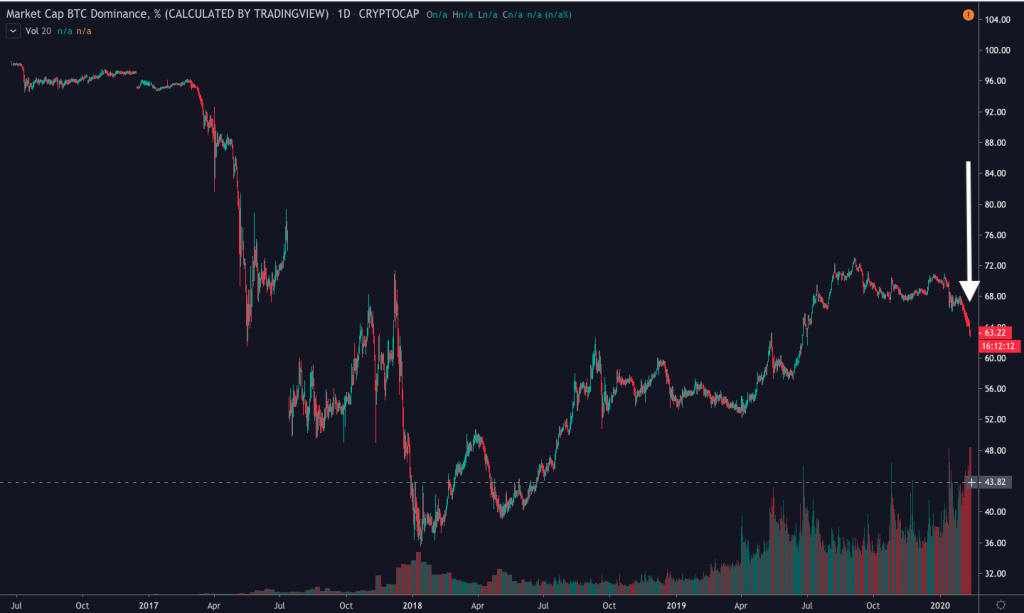
From the graph, Bitcoin’s market capitalization has gradually decreased since the beginning of this year (see the marked arrow). On the contrary, Tezos saw a 200% gain during the same time period. Other Altcoins like ETH and XRP have been outpacing BTC in terms of YTD returns as well.

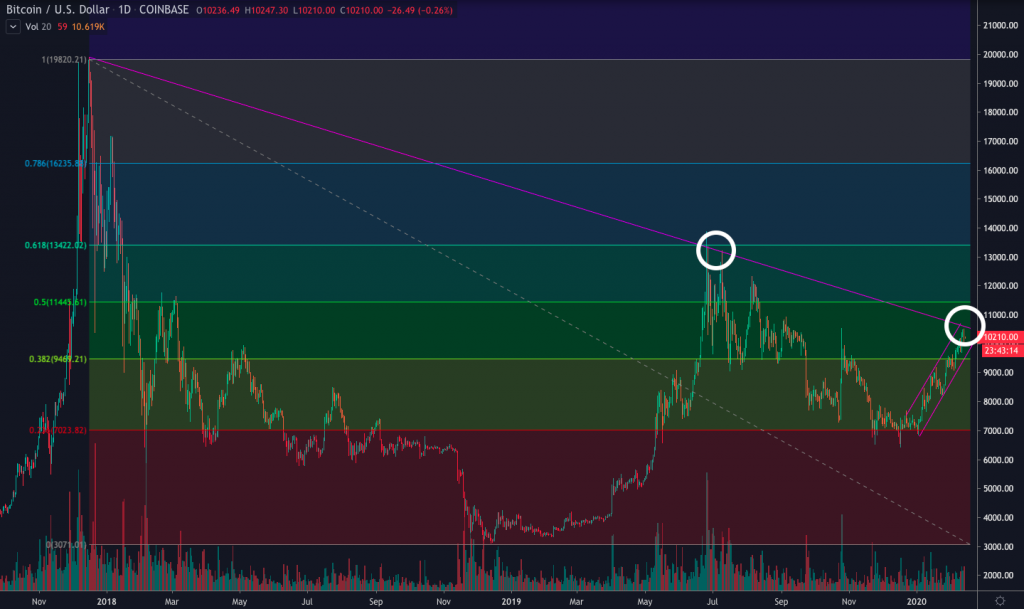
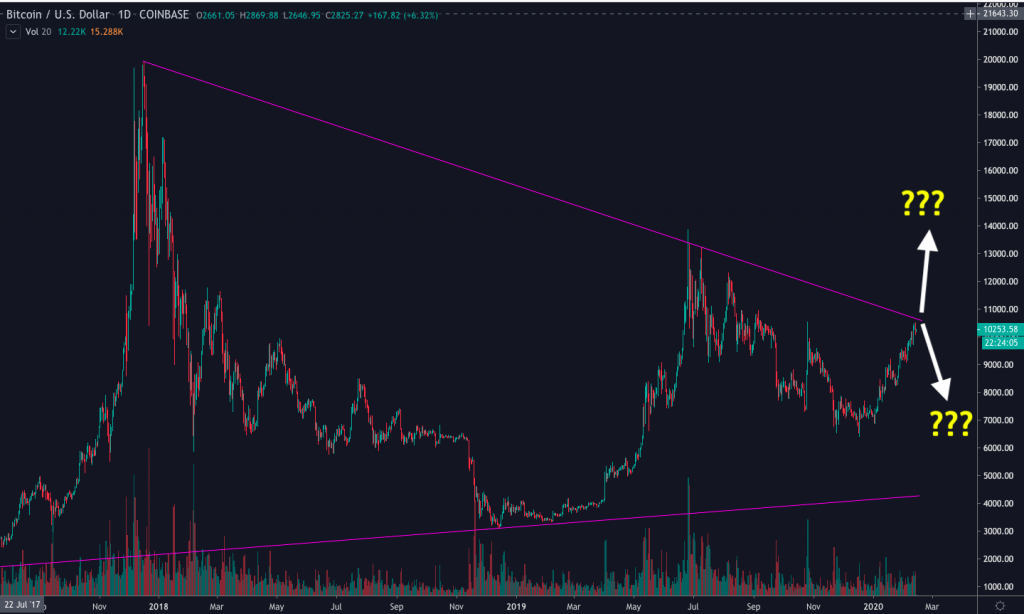
Although, this technical graph assumed that we will see a Bitcoin breakout of the long-term descending trend-line from the previous bull market. From the peak in 2018 at the price of around $20,000, Bitcoin attempted to break out from this downtrend line twice, last year. However, after failing to break the resistance, BTC took a dive down and fell to find support at the level of $6,500. Right now, Bitcoin seems eager to test this challenging down trend line once again.
Hypothetically, If Bitcoin manages to break above the trend line, this means the bulls are back in control and BTC is in a new uptrend cycle. The next significant resistance level would be at $11,500 according to the Fibonacci sequence. In case of failure, Bitcoin would likely fall to find support at around $9,500.

The upcoming Halving is one of the main factors that continuously push Bitcoin’s price higher. For the short-term, BTC’s overhead resistance level is at $10,550 and the first formidable support level is at $9,600. However, this was just past statistics. Investors should thoughtfully consider the risks and refer to technical graphs before trading.
You may also want to read: Bitcoin Breaks $9,500. What is the Next Target?


